With projections of greater than 8 GW of distributed solar being installed, and more than 40 GW of utility scale solar, the country is projected to grow its solar fleet greater than 25% from its 2023 deployments.
Solar power is leading the U.S.—and the world—in energy deployments. The U.S. is projected to deploy nearly 50 GW of solar modules by the end of 2024. This value will be a 25 percent increase from 2023, and close to pv magazine USA’s projections from the beginning of 2024.
According to Ohm Analytics, the U.S. deployed approximately 6 GW to the distributed generation solar market in the first three quarters of 2024. Ohm Analytics projects that the U.S. may deploy 8.1 GW of solar by the end of 2024.
The fourth quarter often outperforms the rest of the year as solar owners scramble to deploy projects before the new year and lock in the Investment Tax Credit against their upcoming tax bill.
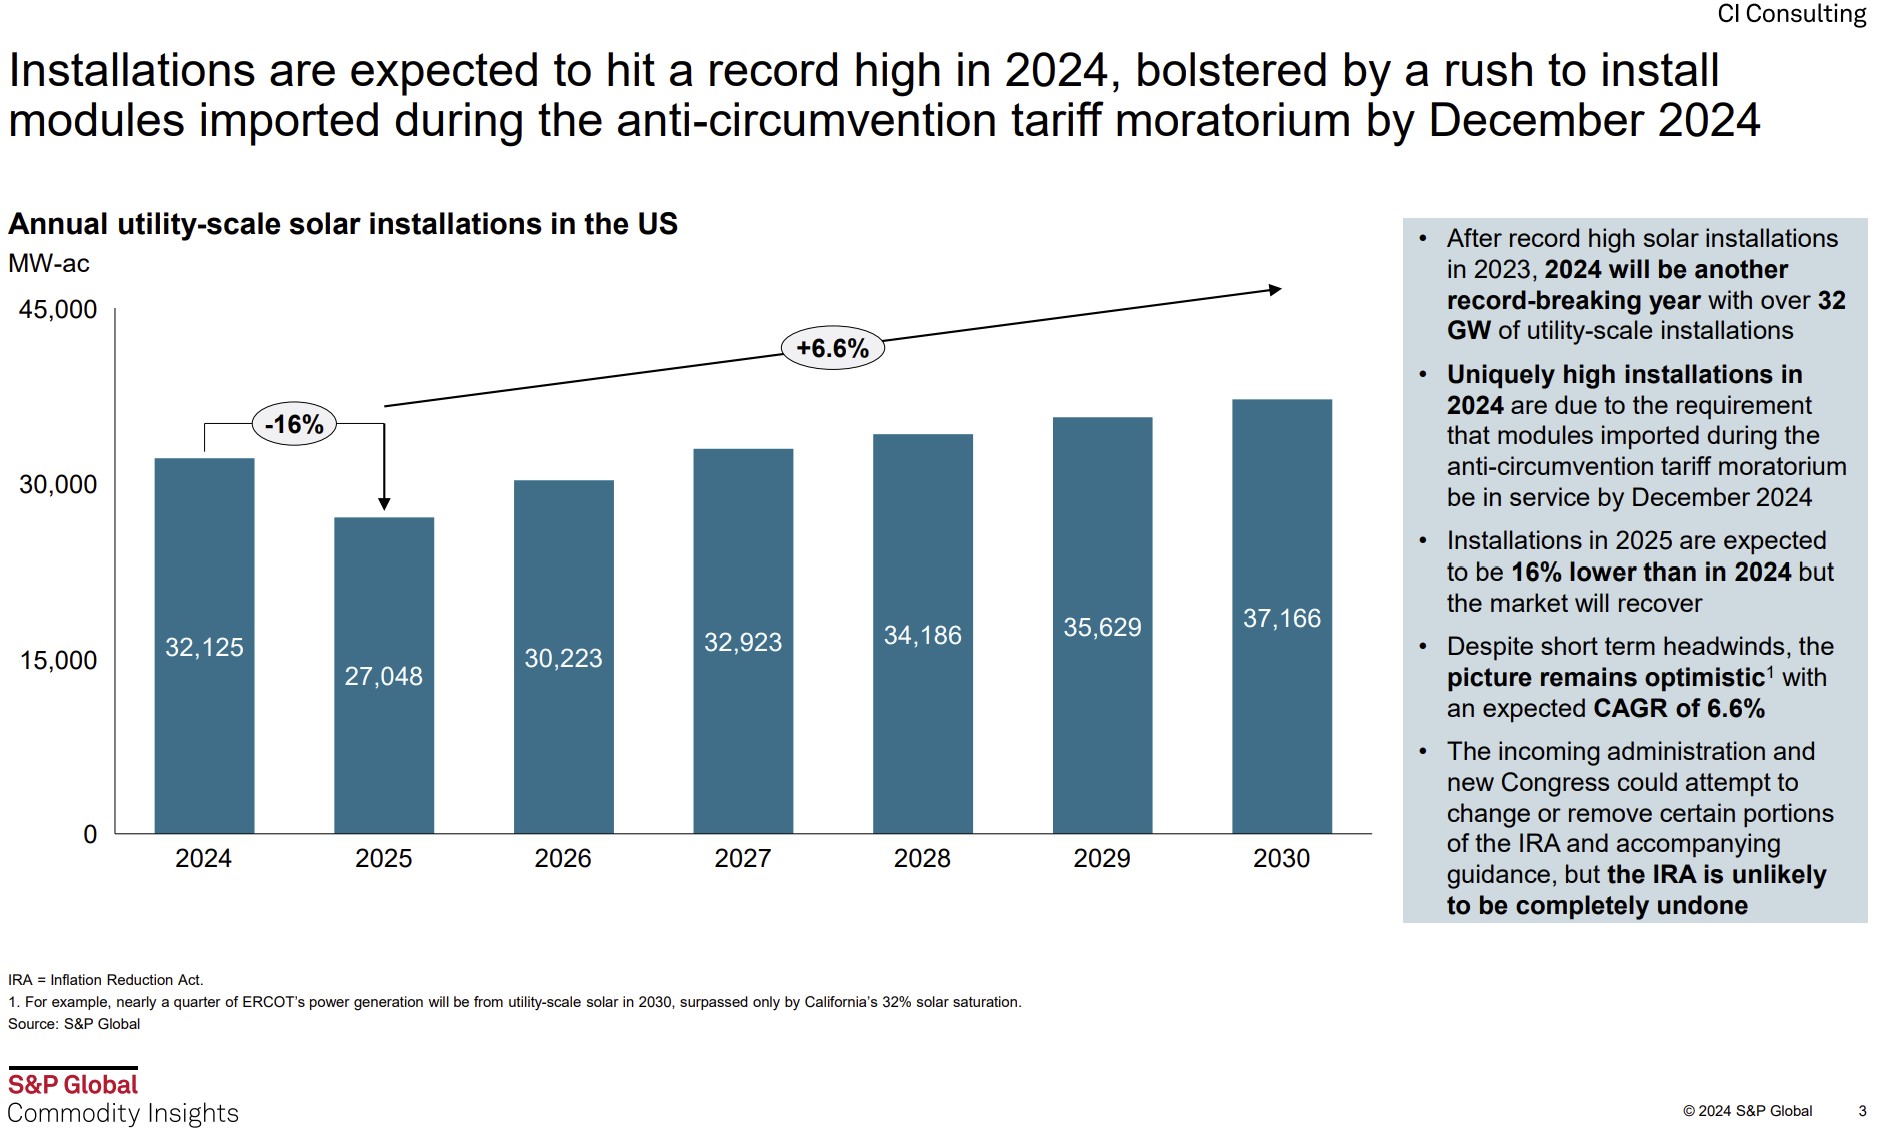
The utility-scale sector is projected to deploy 32 GW worth of solar interconnection capacity by the end of 2024. When converted to solar-module capacity, using a multiplier of 1.25 to 1.3, between 40 GW and 41.6 GW of solar panels. In 2023, utility-scale solar had a multiplier of 1.25.
Combined with the 8.1 GW of distributed generation, and current projections show between 48.1 GW and 49.7 GW of solar panels deployed. This is within a striking distance of 50 GW.

Source: Solar Market Monitor by S&P Global Commodity Insights
When asked by pv magazine USA if 50 GW is a reasonable capacity for the U.S., Jenny Chase, a solar analyst at BloombergNEF, said, it is “Totally possible the U.S. breaks 50 GW (dc) new build.”
Chase said BloombergNEF’s current midpoint projection for U.S. solar-capacity deployment in 2024 is 45.6 GW, with a high of 51.8 GW. Chase said her team projects 599 GW of solar power will be deployed globally, which is the group’s midpoint projection.
According to Chase, the U.S. imported 58.48 GW of solar cells and modules in 2023, and 57.38 GW from January through September this year. “Even if the official stats never show 50 GW (dc) built, it’s not impossible,” she said.
Based on the U.S. Department of Energy’s Energy Information Administration (EIA) 860M documentation, there is a close shot at 50 GW, but there is also about 1.5 GW of potentially double counted capacity. The 860M form, a monthly update of utility scale electricity generation capacity, said that 20.24 GW of utility-scale grid capacity solar has been deployed, and that another 17.1 GW may be turned on in the last two months 2024.
This 37.4-gigawatt grid capacity, computes to between 46 GW and 48 GW of utility-scale solar modules being deployed in the U.S. Adding residential solar alone to this capacity would likely push the U.S. beyond 50 GW.
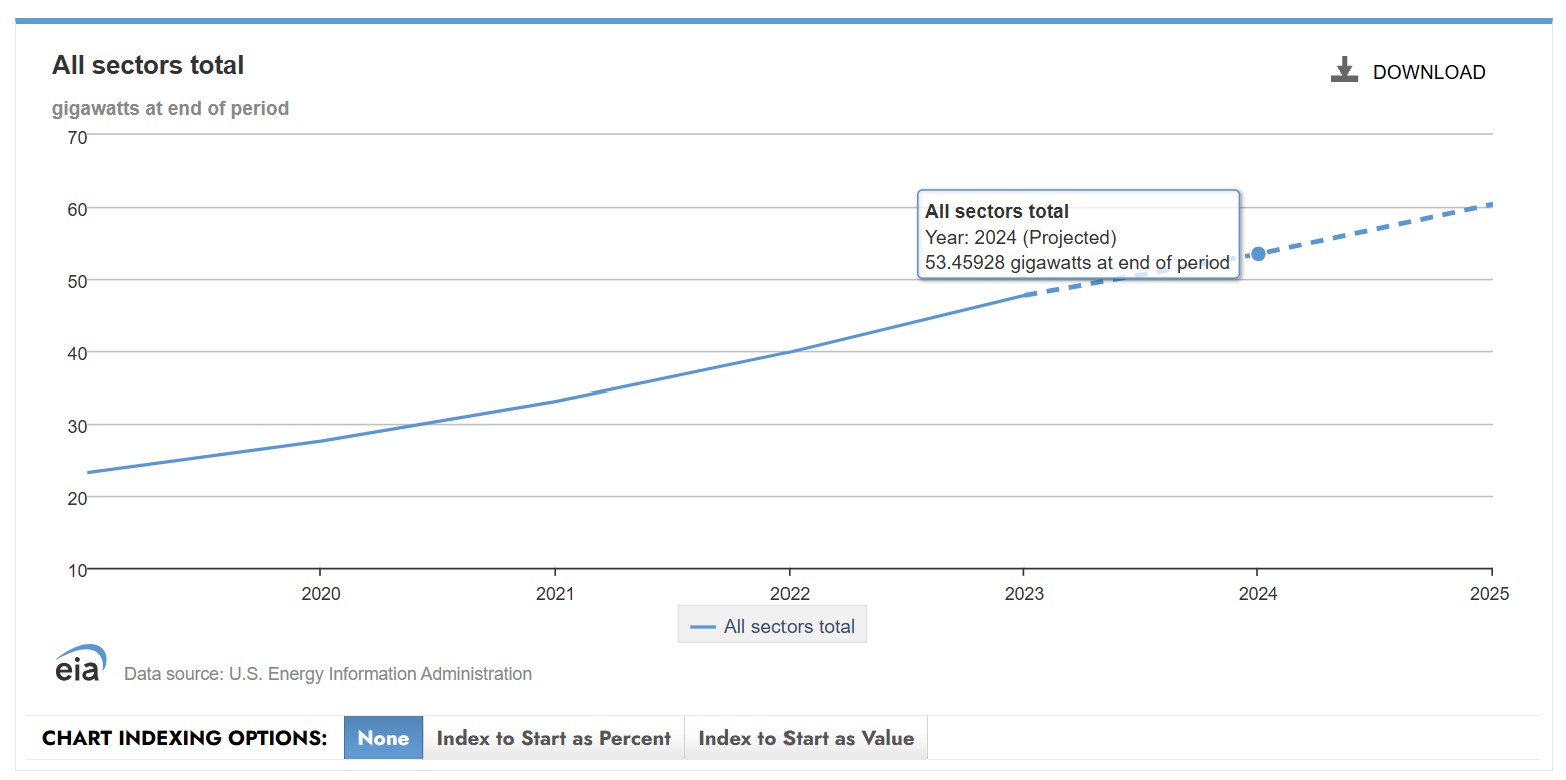
Looking at the EIA’s Short-Term Energy Outlook Data Browser projections shown below, the EIA projected the U.S. would cross 53 GW of both large- and small-scale solar capacity this year.

Source: EIA STEO Data Browser
Questions on projections
Several variables add questions to these final values, including simply how to calculate the deployed capacity.
For instance, in 2023, Wood Mackenzie Renewables adjusted its final solar deployment value from 32 GW deployed to 40 GW deployed, after adjusting their numbers based upon how Texas accounts for projects connected to the power grid.
A second variable that slightly muddles the value is what is considered a “utility scale.” If we go by the EIA’s 860M chart, there are approximately 1.4 GW to 1.5 GW of projects under 5 MW of grid connection capacity that count as a utility scale. However, much of this volume may be accounted for in Ohm Analytics’ community solar volume.
A third variable that might push past 50 GW is a potential surge in developers attempting to deploy capacity before retroactive tariffs go into effect in December on the tens of gigawatts of imported solar modules.
Popular content


