From January through October 2023, solar photovoltaics contributed 5.78% to U.S. electricity, with just over 6% coming from the source in October alone.
The Energy Information Administration (EIA), a division of the U.S. Department of Energy, released its Electric Power Monthly report for the first ten months of 2023. The data shows consistent growth in solar power, supported by high installation volumes in 2023, and a notable increase in wind power output toward the end of the year.
PV Intel data indicates that from January to October 2023, solar power accounted for 5.78% of U.S. electricity, an increase from 4.98% during the same period the previous year. This marks a 16% increase in solar power generation over the previous year.
During the rolling twelve-month period, (November 2022 to October 2023), solar generation contributed to 5.36% of the U.S. total electricity, rising from 4.63% in the previous October. This also represents a 16% increase, over a somewhat different time period.
Source: PV Intel
In another perspective, for October alone, solar power’s share of total generation held just above 6%, and is expected to decline, similar to the 29% decrease observed in 2022.
If 2023 concludes with an estimated 16% increase in solar generation, it would be the second-lowest growth year since 2018, which saw only a 15% increase. This modest growth in 2018 was essentially a hangover following the boom in 2016, which saw a remarkable 53% growth over 2015. Assuming a steady 16% growth rate, 2023’s solar generation is projected to reach approximately 5.46%. However, this figure could be slightly higher, taking into account the significant capacity of solar installations deployed as the year progresses.

Source: PV Intel
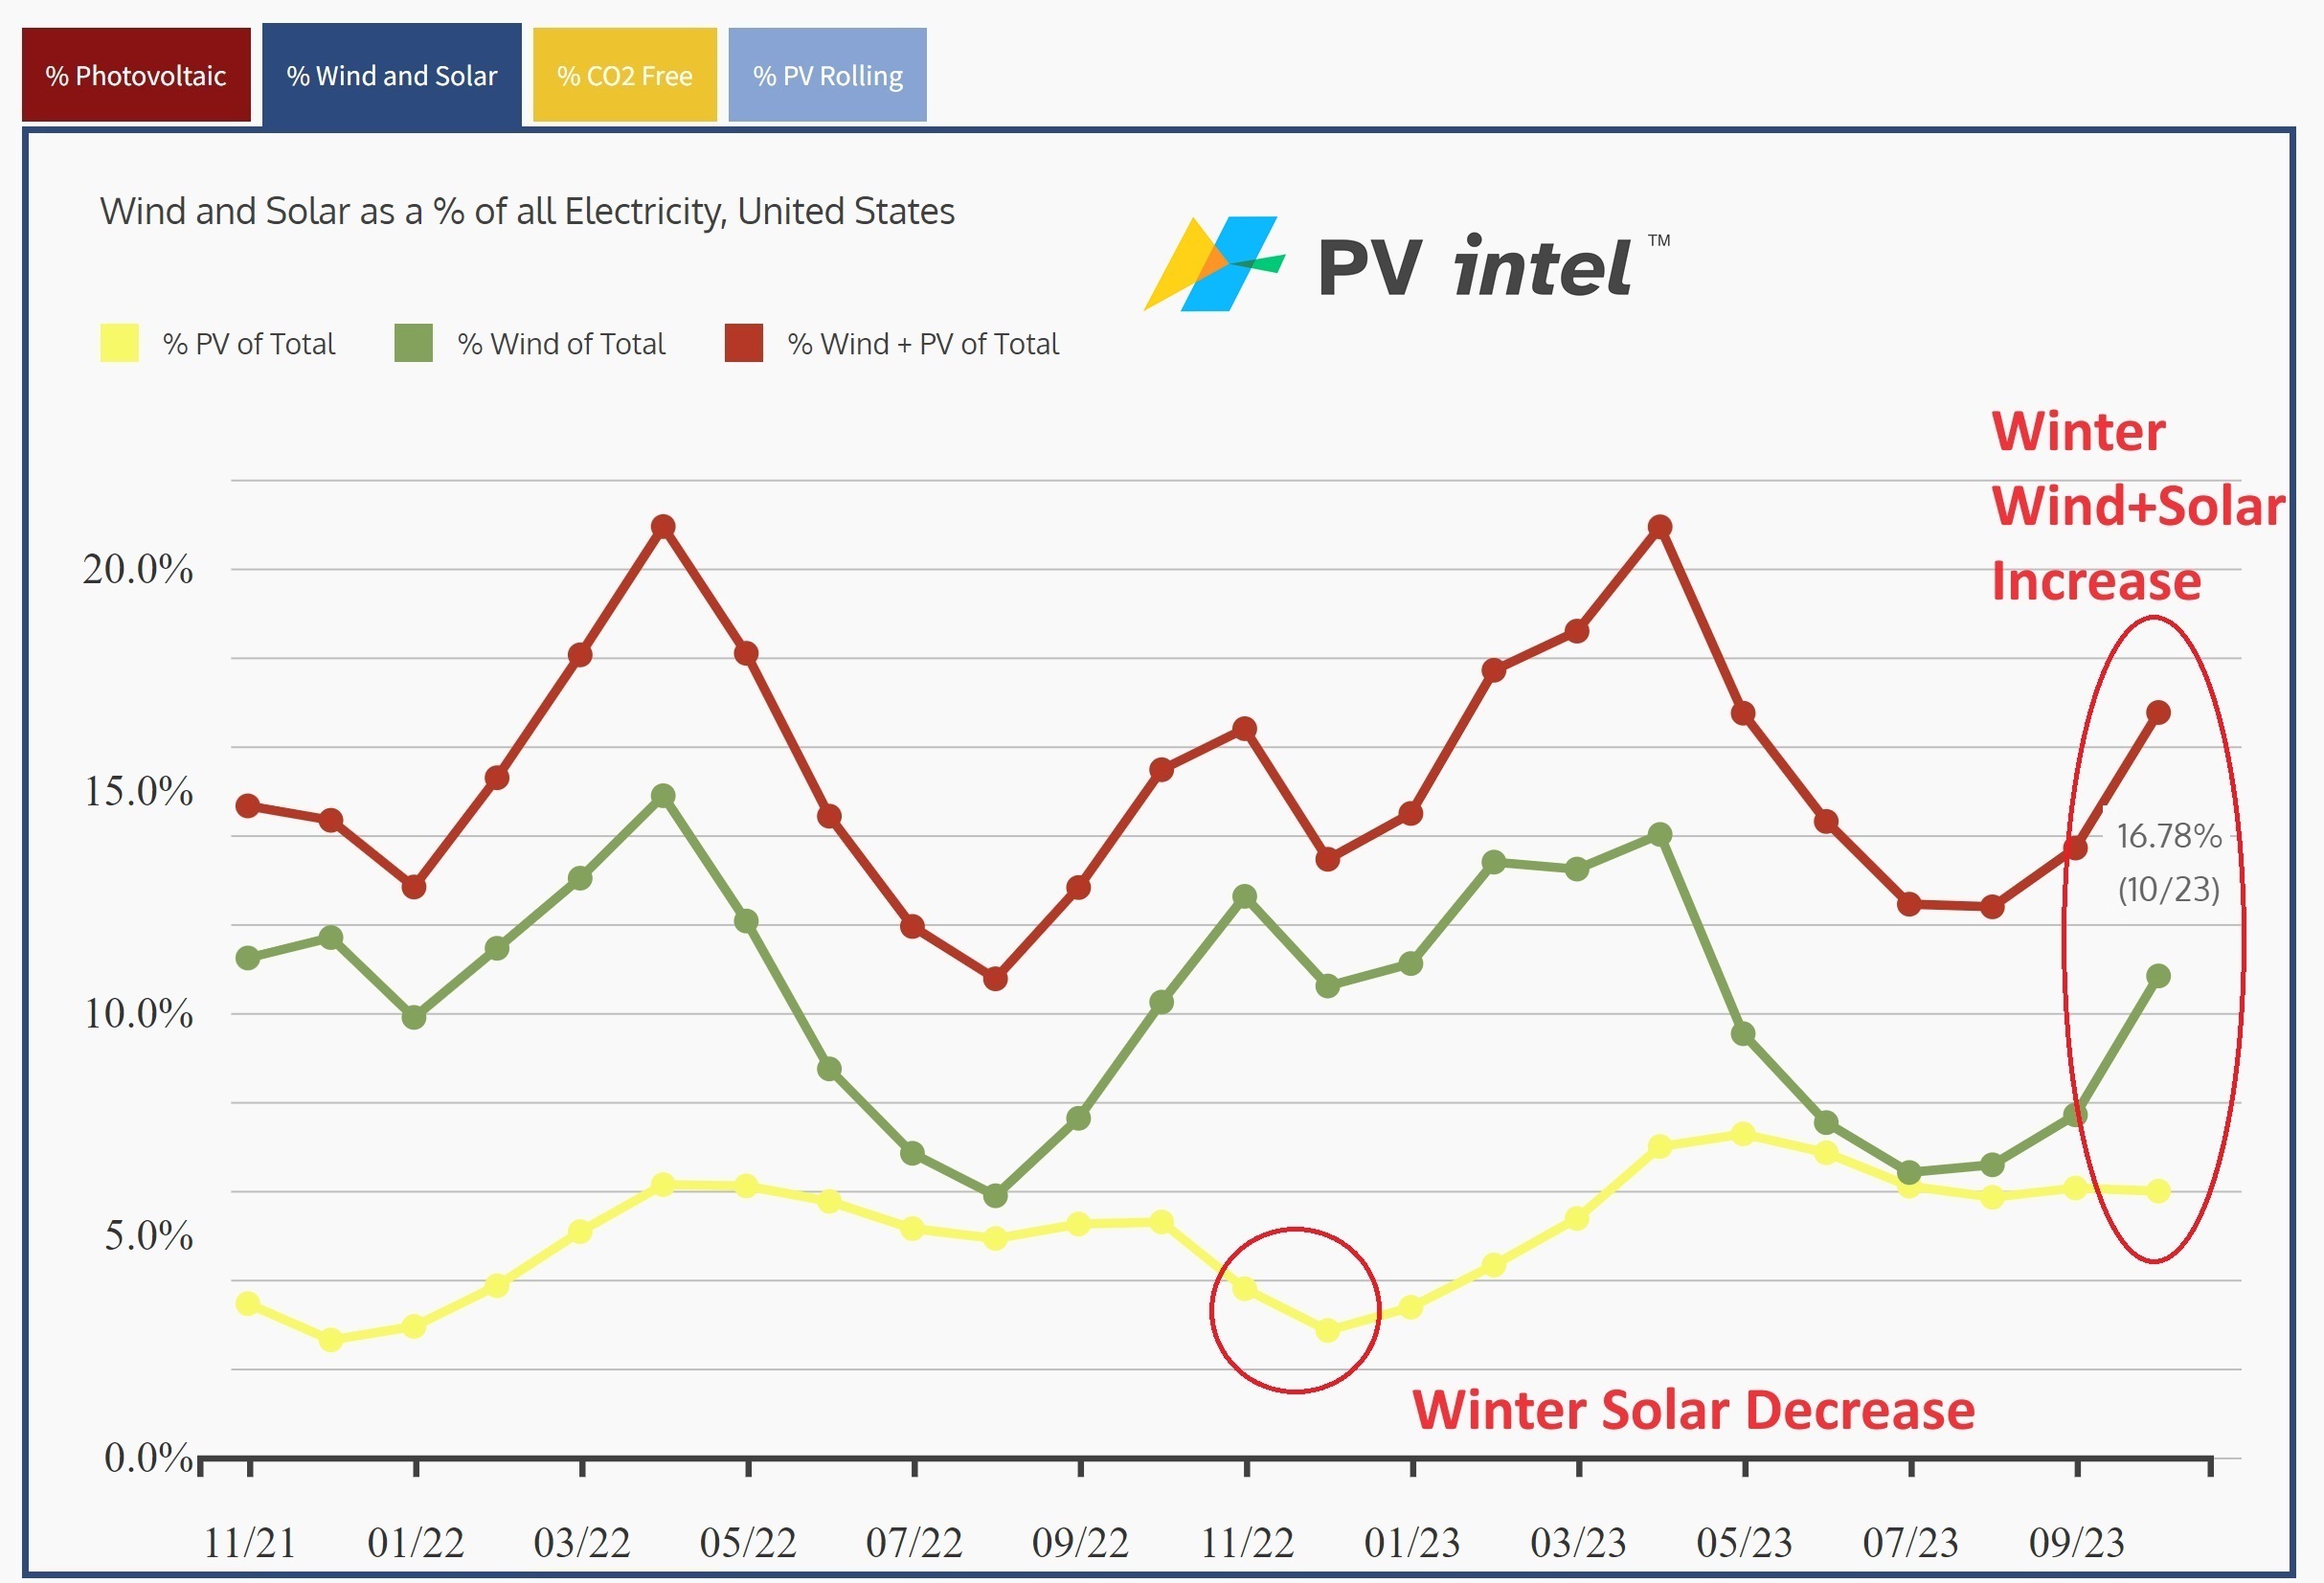
Despite achieving 5.78% so far in 2023, the rate is expected to decline during the winter months. For example, in October 2022, solar generated 4.98% of all U.S. electricity, but by year-end, this figure had dropped to 4.7% due to decreased generation in November and December, which coincides with the year’s shortest days.
Fortunately, this decrease in solar output aligns with an uptick in wind generation. As shown in the graph above, when solar output decreases in November and December, wind generation starts to increase, peaking in March. In October, wind and solar combined produced 16.78% of U.S. electricity generation.
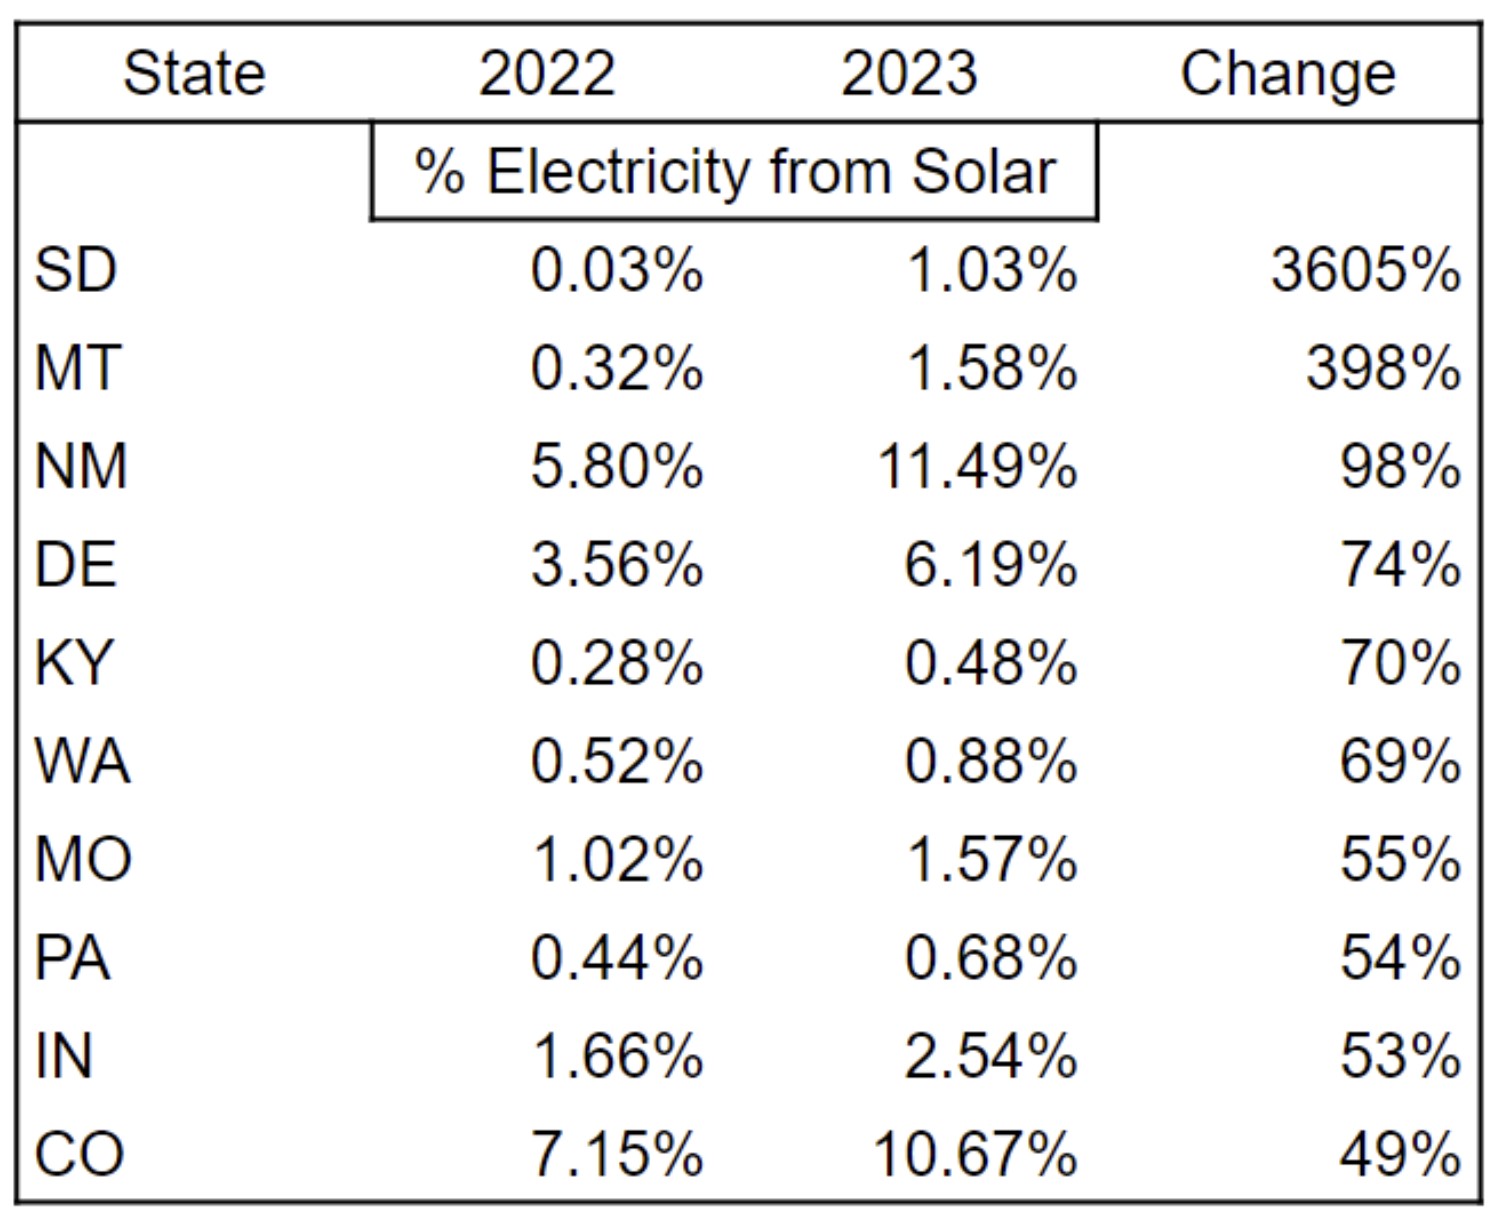
October also saw several states achieving remarkable growth in solar generation compared to the previous year. South Dakota, for instance, experienced an extraordinary surge with a 3,605% increase in solar generation. Montana also saw a significant rise of 398%. These dramatic increases were largely due to the commissioning of large, utility-scale solar installations, which dwarfed the states’ existing solar capacities.

Source: PV Intel
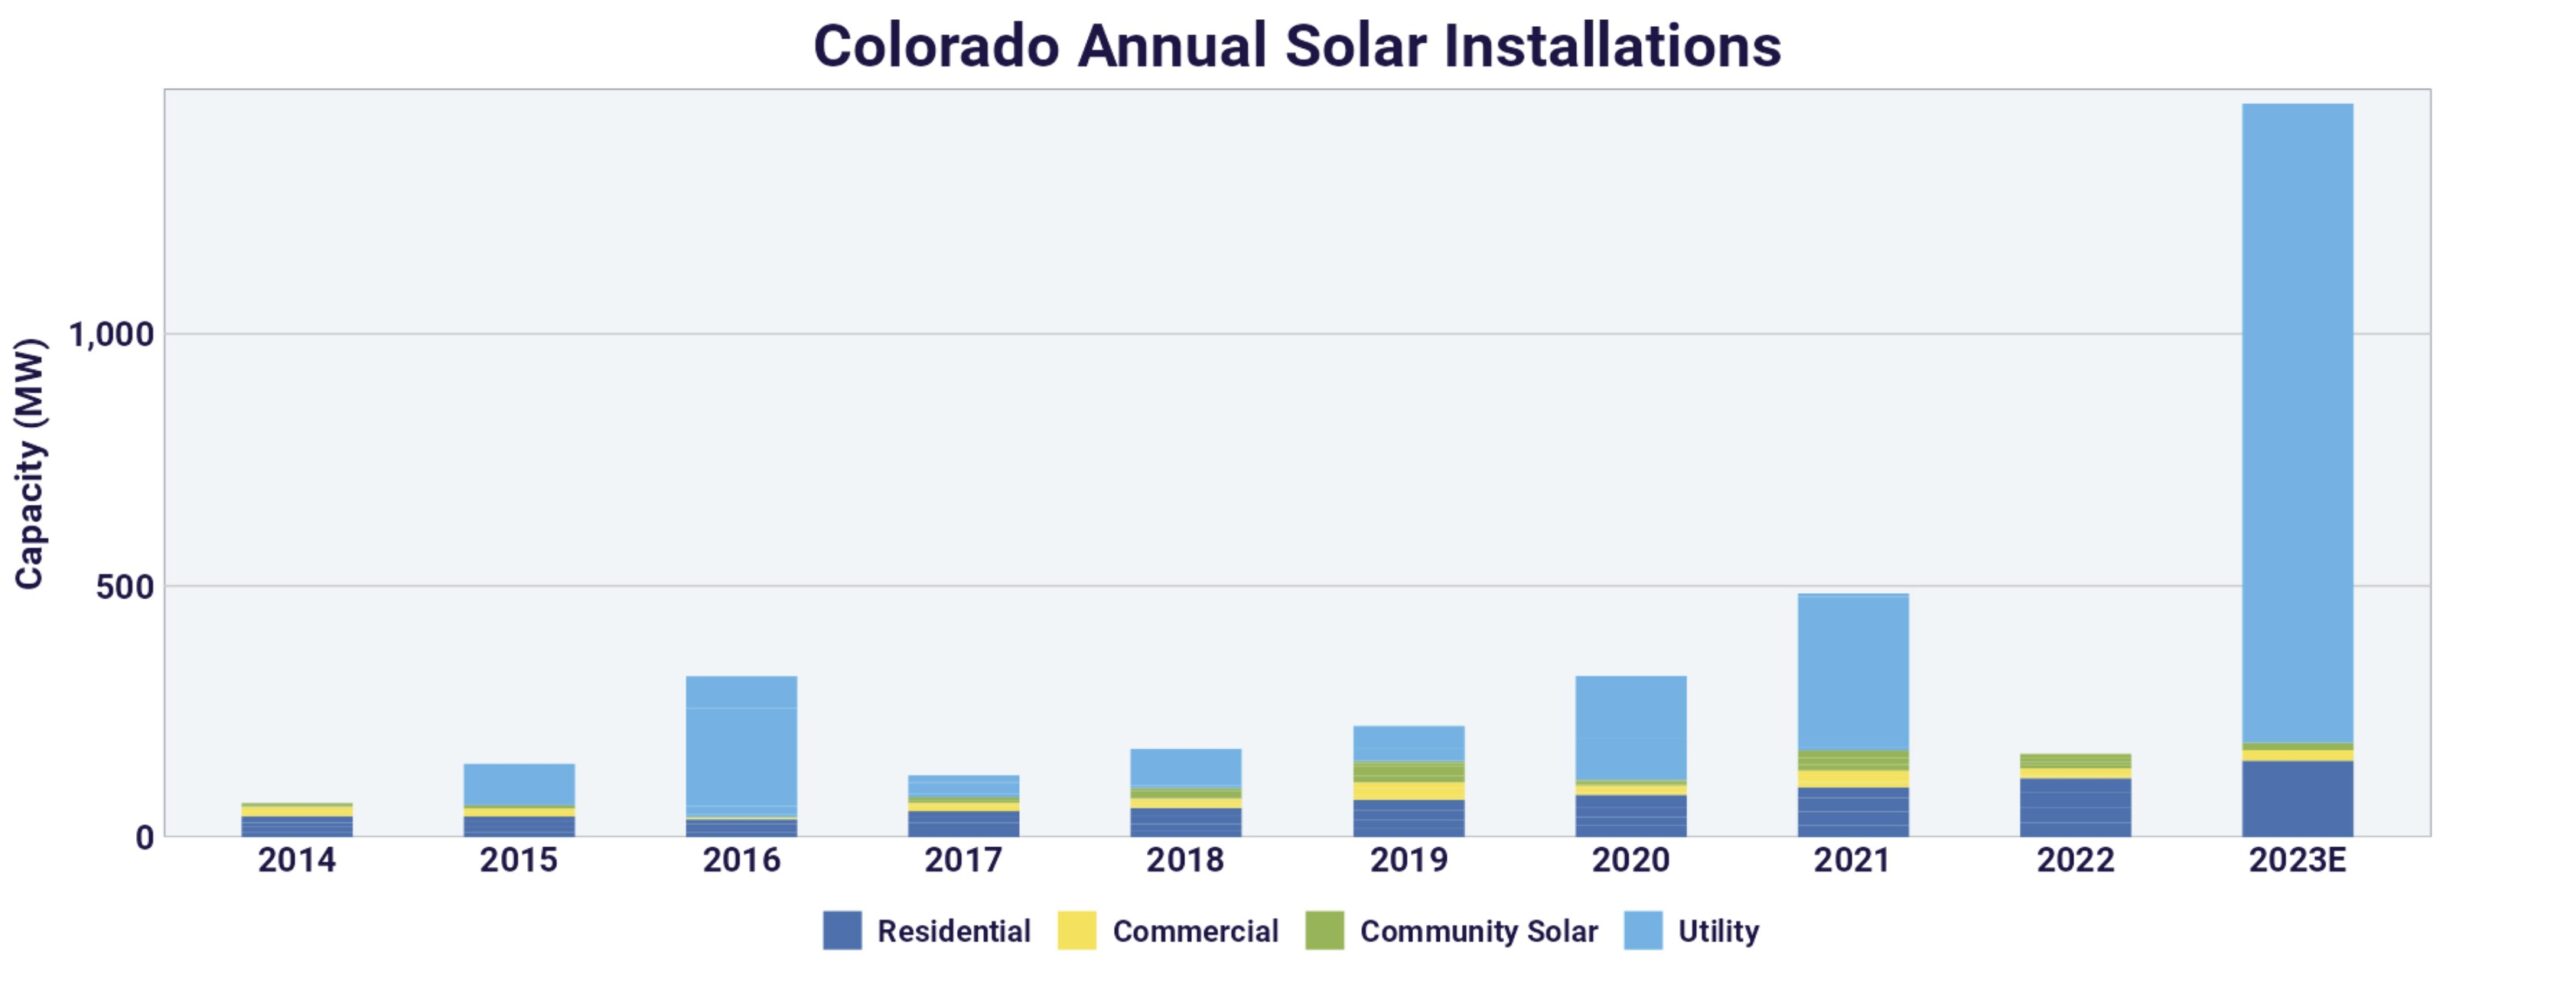
Most states registering high growth in solar generation started from a baseline of less than 2% of their electricity derived from solar. This low starting point means that even the addition of a single large facility can have a significant impact on its overall solar output. However, states like New Mexico, Colorado and, to a lesser extent, Delaware, have experienced growth from higher base percentages. For example, Colorado’s solar generation grew by 49% due to the commissioning of seven utility-scale solar facilities, including two major plants with capacities of 325 MWac and 248 MWac.

Source: SEIA
It is important to note that monthly data can sometimes include anomalies that may affect its reliability. For instance, a recent decrease in jet stream activity on the West Coast led to lower moisture levels, affecting areas from California to New Mexico and the Midwest. As a result, irradiance levels were 10% higher than usual in October.
With more than 30 GW of solar power expected to be deployed in 2023, the EIA’s 860-M form, known as the “Monthly Electric Generator Inventory,” is especially active. In October alone, the document reports that 36 utility-scale solar power facilities were commissioned, adding a substantial 2,466 GWac of capacity.


