When it comes to solar asset performance, the finance industry disclaimer sums it up: past performance is no guarantee of future results. But we can learn from the past, design for an uncertain future and minimize the losses if something goes awry.
While accurately estimating production is a whole topic to itself and basic site maintenance — soiling and vegetation management — is self-explanatory, understanding the impact of equipment choice on production is critical. Most underproduction risk, even that caused by extreme weather, can be either mitigated through design and equipment choices or minimized through insurance.
Location, location, location
Mitigating production shortfalls begins well before ground is broken and even before a project is designed. Location matters, and some areas face higher exposure to extreme weather than others. The microclimate of a location can not only impact production but also increase downtime related to physical damage. This doesn’t mean avoiding building solar in vulnerable areas, but it does mean designing for resilience.
Start with building in ways to identify worsening weather at the site and specifying equipment that can react to it, such as trackers that can move modules into a stow position ahead of extreme weather, says Rosa Van Reyk, senior underwriter at renewable energy project underwriter GCube. This advanced planning varies by area.
“Designing with a higher windspeed tolerance on the Eastern Seaboard, Tornado Alley and Gulf of Mexico is advised,” Van Reyk says.
Other mitigation strategies include raising equipment in flood risk areas and creating a vegetation management plan when there’s medium to high wildfire risk.
“The Southeast saw more of every kind of anomaly than in other parts of the U.S., and in particular, physical damage was much more prevalent,” says Eddie Obropta, Raptor Maps cofounder and CTO. “This indicates to us that the region was particularly susceptible to extreme weather events that impact solar power production.”
Last summer was a case study in the cost of ignoring regional weather risks. “The hail losses experienced in Texas in early Summer 2022 resulted in solar losses estimated in excess of $300 million,” according to GCube’s North American Nat Cat Update, “almost twice as severe as the other key renewable losses [in Texas] of the past three years combined, and close to ten times as severe as losses from 2020’s Hurricane Hanna.”
Specifying hail-resistant modules and stowable trackers could have lowered those losses. The higher cost of resilient equipment may be offset in part by lower insurance premiums and deductibles, Van Reyk says, “but unfortunately we have seen severe and costly damage across a range of technology.”
Faulty equipment and workmanship never pays
After commissioning, the quality of components, workmanship and maintenance come into the spotlight, and that quality sometimes falls short.
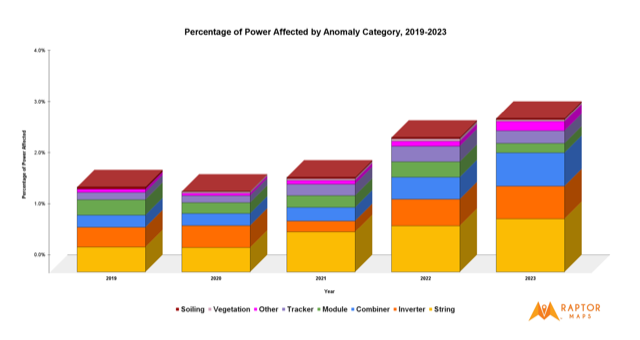
The rise in anomalies — identified system defects that can be as small as a damaged module and as large as a failed inverter or combiner box — is obvious to many stakeholders and Raptor Maps’ 2023 Global Solar Report shows the trend continuing.
“Power loss due to anomalies has increased by 92% since 2019 when we started our Global Solar Report and by 19% year-over-year, impacting more than 3% of power in 2022,” Obropta notes. “The implications of that upward trend could easily amount to tens of thousands of dollars in lost revenue.”
Production in the first few years of a site’s life are likely to vary from modeled production more than in later years with “system performance improving relative to expectation as projects age,” said Daniel Herron, business operations manager at kWh Analytics, citing the company’s analysis of more than 500 utility-scale PV projects with up to 10 years of operational history. “One potential explanation for this is that owners are able to achieve more reliable performance after overcoming startup challenges in the first few years of operation.”
Inverters are the weakest point when it comes to production losses due to equipment failure, accounting for about 60% of loss events, according to Frank Kelly, VP at NovaSource Power Solutions, in his paper in Solar Risk Assessment 2022, published by kWh Analytics.
When looking at losses in terms of total energy lost rather than the number of events, the picture changes a little. See Fig. 1

Some equipment risks are surprising: combiner boxes are one of the least sophisticated parts of a solar plant yet account for a significant amount production losses because they “affect more power than, say, a singular module-level issue,” Obropta says. “Some of the more common combiner box failures are due to improperly torqued wire terminals overheating, rodents and moisture penetration. In all of these failure types, workmanship or manufacturing error are the cause.”
While there is more data than ever before, there is a dearth of long-term data. More than 60% of all the solar installed in the U.S. today is less than five years old, and in that time modules, inverters and trackers have all evolved significantly, becoming both smarter and more efficient.
The industry’s understanding of equipment risk will continue to improve. KWh Analytics is using a Department of Energy grant to partner with NREL, Sandia National Lab and SEIA to comb through more than 50,000 maintenance logs in search of the most common PV systems failure modes. “Preliminary results suggest inverter-related issues are the most commonly cited, followed by tracker, transformer, module and combiner issues,” Herron says.
That insight will enable better risk pricing and let insurers offer discounts akin to the “safe driver discounts” car drivers can receive. “The goal is to develop a feedback loop in the form of a discount through our insurance offerings to incentivize resilient site design,” Herron says.
Insuring against underperformance
The two most common types of solar asset coverage insure against production losses and insure for physical damage.
In January this year, kWh Analytics partnered with Aspen Insurance to launch Property Insurance, which covers solar and other renewable projects for physical damage. The offering complements the company’s Solar Revenue Put, a production insurance product it launched in 2018 that insures more than $4 billion of assets to date.
GCube provides an ‘All Risks’ policy, though most insurance is bespoke, Van Reyk says. “Anything is covered unless it is specifically excluded. Common exclusions include willful negligence by the insured, liquidated damages, dishonest or criminal acts, cyber-attack and infrastructure such as transmission and distribution lines beyond a certain distance.”
Even prototypical technology can be covered, though likely with higher deductibles or sublimits than proven technology, Van Reyk said.
The emergence of new insurance offerings indicates not only an increasing need to mitigate risk but also an improved ability to quantify that risk. The rise of specialist solar insurance reflects the need for a nuanced understanding of the asset. It takes deep data to be able to sanity-check modeled production and account for failure rates of different equipment, and that data gap is quickly being filled.
Dej Knuckey is a contributor to Solar Builder. She’s a journalist, author and freelance writer who has covered energy for publications in Australia and the United States.
Tags: GCube, kWh Analytics, NovaSource Power Services, Raptor Maps, resilience, resiliency, utility-scale


