In 2020, 3.7% of U.S. homes generated electricity from small-scale solar arrays, as did 1.6% of commercial buildings, reports the Energy Information Administration.
According to the 2020 Energy Information Administration (EIA) residential energy consumption survey, about 3.7% of U.S. single-family homes generated electricity from small-scale solar arrays. In EIA’s 2018 commercial energy consumption survey, it was found that 1.6% of commercial buildings have small-scale solar generation.
Residential solar buildout varies widely by region. The West had the most with 8.9%, followed by the Northeast (4.7%), the South (1.7%), and the Midwest (1.4%).
Commercial solar adoption was also most common in the West with 3.8% of buildings generating electricity with local solar. This was followed by the Northeast (2.5%), the Midwest (0.8%), and the South (0.6%).
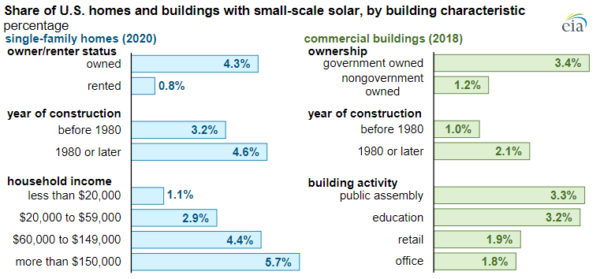
The presence of small-scale solar on residential and commercial buildings also differed by year of construction, said the report. Buildings constructed after 1980 were more likely to have solar installed.
The report also found that 5.7% of households with incomes of more than $150,000 installed solar, while 1.1% of households with incomes less than $20,000 installed solar.

The EIA survey also found that government-owned buildings were more likely to have small-scale solar generation than non-government ones. Buildings used for public assembly, education, office space, or retail accounted for 61% of all commercial buildings that reported having small-scale solar generation.
On the rise
Solar adoption at all sectors, residential through utility scale, is expected to increase significantly over the next decade. Following the implementation of the Inflation Reduction Act, a study by Princeton University said solar deployment may accelerate from 2020 rates of 10 GW of capacity added per year to nearly five times as much by 2024, adding 49 GW of utility-scale solar each year. Solar deployment may be well over 100 GW per year by 2030, said Princeton.
Investment in solar could reach $321 billion in 2030, nearly double the figure of $177 billion expected under current policy. The Act is expected to lead to nearly $3.5 trillion in cumulative capital investment in new American energy supply through the next decade, said the report.
Annual U.S. energy expenditures are expected to fall by at least 4% in 2030 under the act, a savings of nearly $50 billion dollars per year for households, businesses and industry. This translates into hundreds of dollars in annual energy cost savings for U.S. households. Tax credits, rebates, and federal investments in the Act would shift costs from energy bills to the progressive federal tax base.


