The 2022 Solar Risk Assessment focuses on inverter failures and rosy risk projections, which are the leading causes of economic loss for utility scale solar facilities.
Fourteen groups, including kWh Analytics, have come together to release the 2022 Solar Risk Assessment (SRA). This document brings attention to the challenges that have resulted in reduced electricity generation at solar power facilities.
The report found that when it comes to the money, 92% of lost earnings – before interest, taxes, depreciation, and amortization (EBITDA) – are a result of reduced electricity generation. Thus, the report attempts to pick apart why generation fell short of projected goals.
kWh Analytics cites three main challenges:
- Developers underestimated the probability of p50 and p90 rated risk events
- Inverters went down more often than projected
- Disappointing US weather patterns further decreased generation.
The report suggests that p99 events, which are supposed to happen once every hundred years, are happening every six years. kWh says that developers’ probability estimates are simply unrealistic, and suggest looking for better, data driven projections.
The greatest loss of revenue came from inverters being down more often than developers projected. A report by NovaSource, which manages 20 GW of utility-scale solar facilities, found that 60% of generation losses were due to downed inverters.

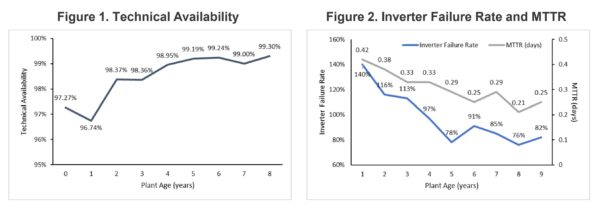
The group looks at failure rate and mean time to repair (MTTR) when measuring their inverters. They found an interesting nuance: inverters fail more, and encounter longer repair times during the first two years. After the first two years, failure rates and repair times improve.
The facility manager of NovaSource suggests that the repair timeframe challenge during the first two years is due to a misalignment of warranty and responsibility during those early hardware periods. During this window, manufacturers have a greater warranty responsibility and put greater limitations on what the contractors can do to inverters to attempt to repair or replace.
Interestingly, after the first two years of inverter life, the amount of uptime increases greatly – to over 99%. This is likely due to electronic failures being weeded out in the field versus in the factory quality check, as well as the discovery and repair of any errors made during installation.
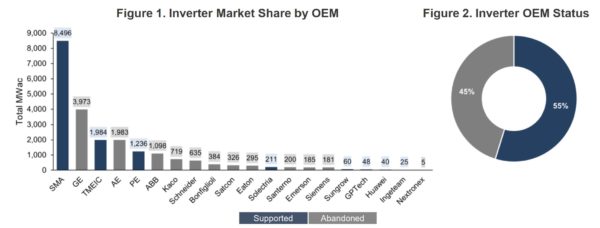
A separate analysis within the report found that 45% of utility-scale solar under management – 9.9 GWac of capacity – was run by inverters whose manufacturers had gone out of business. The big names are easily recognized: GE, AR, ABB, Kaco, and Schneider. All of these companies are still around, but they’re not manufacturing inverters in this space anymore.

The analysis found that this ‘abandoned’ capacity measured between 1.9 and 2.7 million MWh in production losses, valued between $97-174 million per year in 2017 and 2018.
It is suggested that the repowering of facilities will require more hardware and will need to occur earlier than financial models initially projected. And when adjusting from one inverter model to another, it is sometimes required to rewire portions of the solar field to meet the new requirements.
NovaSource, an O&M company with many gigawatts of capacity under management, noted:
Solar facilities with equipment from discontinued inverter manufacturers saw average inverters perform at 85% technical availability. In contrast, industry standard aims for 97% to 99% power plant availability.
NovaSource and kWh Analytics say that these inverter issues – reduced availability, and out of business manufacturers – are good reasons for developers and asset owners to mitigate risks by testing inverter units in the warehouse before deploying them. They also recommend stocking these units more aggressively.
Additional generation and O&M factors that were considered in the analysis:
- Projections on uneven terrain are challenging, and may result in production overestimates of up to 6%
- Complex installations and balance of system anomalies affected a greater number of systems in 2021 than 2020
- Some solar modules are degrading at a higher rate of 0.75%/year versus the industry standard of 0.5%/year
- Overall, there have been more ‘high risk module purchases’ happening from manufacturers with substandard quality control
- An increased frequency of wildfires in the Western United States is creating a measurable impact on solar production


