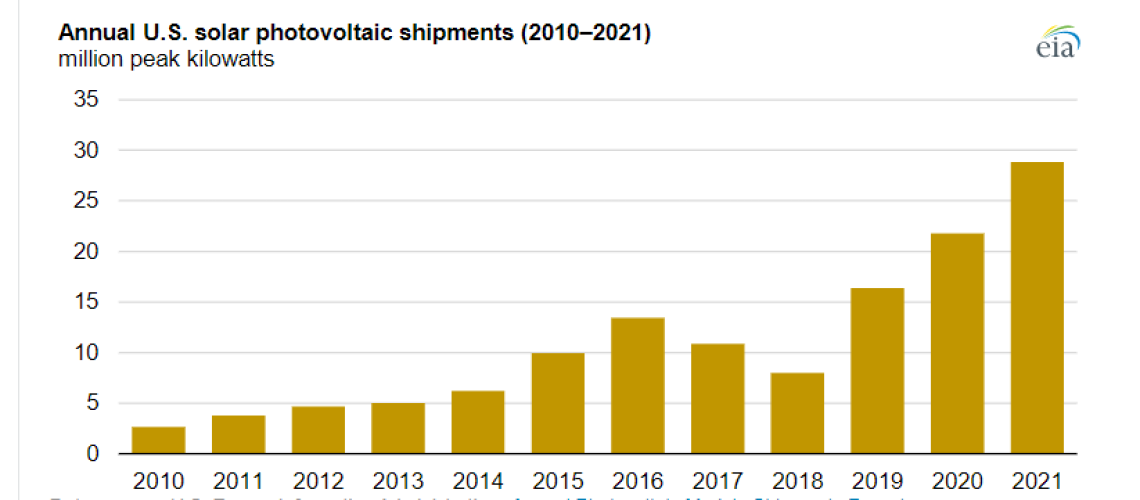
The Energy Information Administration module shipments report showed a steady climb in shipments. Plus, the U.S. may pivot to a domestically sourced solar supply chain.
The Energy Information Administration (EIA) releases an annual report on U.S. solar panel shipments, which include imports, exports, and domestically produced and shipped panels. This year’s report found that in 2021, shipments of PV modules rose to a record electricity-generating capacity of 28.8 million peak kW in 2021, from 21.8 million peak kW in 2020.
The shipments represented an increase of 32%, despite module supply issues due to ongoing effect of the COVID-19 pandemic, which sent ripple effects through the global economy, including factory shutdowns, component shortages, and steeply increased shipping and materials costs. This growth occurred in the face of international trade issues, including the Hoshine Withhold Release Order (WRO), and antidumping and anti-circumvention tariff threats.
The United States added 13.2 GW of utility-scale solar capacity in 2021, an annual record and 25% more than the 10.6 GW added in 2020. Research from Princeton University and affiliates projects that these figures could reach 50 GW a year by 2024 and by 2031, that number may reach as high as 100 GW of deployment annually.
Small-scale solar installations, those under 1 MW, increased by 5.4 GW in 2021, a 23% jump over 2020’s deployment rate, said EIA. Residential installations had a particularly strong year totaling more than 3.9 GW in 2021, compared with 2.9 GW in 2020.
Representing 46% of the nation’s capacity, the top five states for U.S. solar panel shipments were:
- California (5.09 million peak kW)
- Texas (4.31 million peak kW)
- Florida (1.80 million peak kW)
- Georgia (1.15 million peak kW)
- Illinois (1.12 million peak kW)
In 2021, the United States had nearly 29 million module shipments. This number was only 320,000 when EIA began reporting it in 2006, and about 3.7 million ten years prior to this report in 2011.
EIA reports 4.2 million modules were manufactured domestically, while nearly 23 million were imported. Export shipments totaled about 1.1 million modules. About 119,000 were purchased from U.S. original equipment manufacturers.
China, Singapore, Taiwan, and Vietnam accounted for 11.3 million modules shipped to the United States. Malaysia accounted for 3.2 million; South Korea, Thailand, and United Arab Emirates nearly 5 million; and “other” nations shipped nearly 3.5 million modules.
Notably, EIA said fewer companies now report on the module shipments “EIA-63B” form due to “company consolidation and changes to strategic planning of companies in the U.S. solar photovoltaic industry.” As a result, EIA’s 2021 report is less detailed to protect confidentiality of company-level data. Data can no longer be published for the specific types of PV cells and modules, or by region.
Domestic supply
In 2021, about 80% of U.S. solar panel module shipments were imports, primarily from Asia. This makeup may be set to change significantly over the next eight years, as the U.S. solar industry eyes a target of 50 GW of manufacturing capacity by 2030.
The Department of Energy (DOE) said, “Greatly expanding U.S. PV manufacturing could mitigate global supply chain challenges and lead to tremendous benefits for the climate as well as for U.S. workers, employers and the economy.” DOE concluded in a study that U.S. production could reach 10 GW in two years, 15 GW in three years and 25 GW in five years on its path to 50 GW annual production.
Currently, the U.S. has capacity to produce materials like metallurgical grade silicon, polysilicon, steel, aluminum, resins, racking and mountings. However, there are significant gaps in the supply chain. United States currently has no domestic solar ingot, wafer or cell manufacturing capacity and only modest capacity to produce solar modules, inverters and trackers, said SEIA. As a result, these segments must be targeted on the path to 50 GW.
The Inflation Reduction Act (IRA) of 2022 has over $60 billion in funds planned to achieve these domestic manufacturing goals, including:
- An investment of $30 billion in production tax credits to accelerate domestic manufacturing of solar panels, wind turbines, batteries, and critical minerals processing.
- A $10 billion investment tax credit to build clean technology manufacturing facilities, including those that make electric vehicles, wind turbines and solar panels
- $500 million in the Defense Production Act for heat pumps and critical minerals processing
- $2 billion in grants to retool existing auto manufacturing facilities to manufacture clean vehicles
- Up to $20 billion in loans to build new clean vehicle manufacturing facilities across the United States
- $2 billion for National Labs to accelerate breakthrough energy research
The IRA also includes tax credits across the solar supply chain:
- Manufacturing credit: 100% credit through 2029, 75% in 2030, 50% in 2031, 25% in 2032.
- Thin film photovoltaic cell and crystalline photovoltaic cell: $.04 per cell capacity in Wdc.
- Photovoltaic wafer: $12/sq. meter.
- Solar grade polysilicon: $3/kg.
- Polymeric backsheet: $0.04/sq. meter.
- Solar module: $0.07 per module capacity in Wdc.
- Torque tube: $0.87/kg.
- Structural fastener: $2.28/kg.
- Central inverter: $0.025 per capacity Wac.
- Commercial inverter: $0.015 per capacity Wac.
- Residential inverter: $0.06 per capacity Wac.
- Microinverter: $0.11 per capacity on Wac.
- Battery module: $10 per battery module capacity kWh.
- Critical mineral: 10% of costs incurred.
- Battery cell: $35 per battery cell capacity kWh.
“With long-term incentives for clean energy deployment and manufacturing, the solar and storage industry is ready to create hundreds of thousands of new jobs and get to work building out the next era of American energy leadership,” said Abigail Ross Hopper, president of the Solar Energy Industries Association.


