

With funding support from the Grayce B. Kerr Fund, Inc., Chesapeake Conservancy’s data science team developed a deep learning model that automatically maps ground-mounted solar arrays in satellite imagery. Using this AI system, annual maps were created of all solar arrays within Washington, D.C., Delaware, Maryland, Pennsylvania, New York, Virginia and West Virginia from 2017 to 2022.
This dataset is the first of its kind and is publicly accessible. The results are published in the peer-reviewed journal Biological Conservation (July 2023).
“We thank the Grayce B. Kerr Fund, Inc., for helping us create data that can empower government leaders, land use planners and conservation professionals in the region,” said Michael Evans, Ph.D., a senior data scientist with Chesapeake Conservancy’s Conservation Innovation Center (CIC). “These data reveal the land use transitions associated with past solar energy growth, and the transitions we’re likely to see in the future if those trends continue.”
Findings | Among the findings: the six states and D.C. have been adding solar capacity at different rates, with Maryland and Virginia expanding most rapidly.
Thus far, solar arrays have primarily replaced cultivated areas, including agricultural fields, pasture and timber lands, while avoiding more natural land cover like deciduous forests and wetlands. Agriculture was both the most frequently converted land use in terms of total area and showed the highest strength of selection in terms of area converted to solar in proportion to available area.
“From a conservation perspective, we were encouraged to see natural areas being avoided over the past six years. In places where solar is replacing previously degraded land cover, these facilities may also present a unique opportunity to restore biodiversity and ecosystem services in the watershed if native vegetation is maintained in areas under and around arrays” continued Dr. Evans.
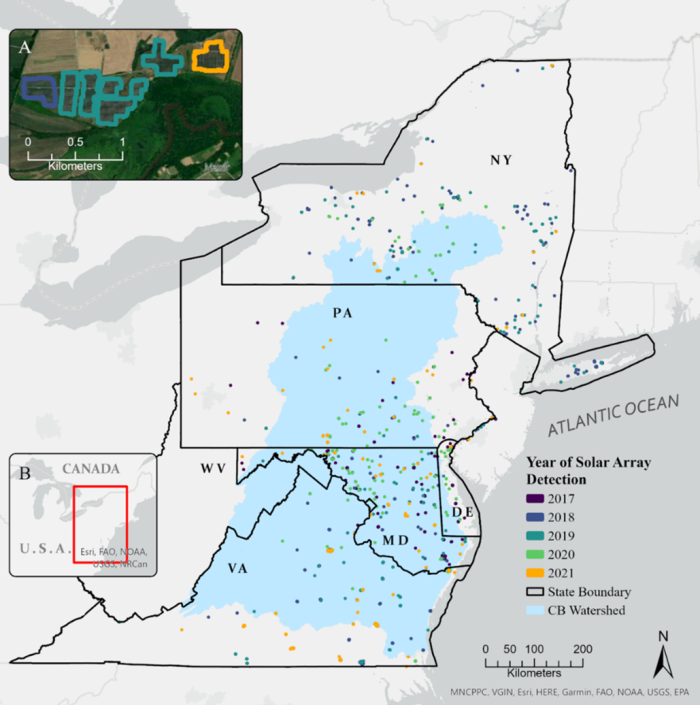
Arrays were mapped for the Chesapeake Bay watershed. Colors indicate the year in which arrays were constructed.
Methodology | Using the observed rates and site characteristics of past solar buildout, the team forecasted and identified the areas within the watershed most likely to be developed for solar.
At each observed solar array, the team recorded a suite of geospatial covariates, including slope, protected status, percent open/forest/impervious/cultivated landcover, distance to road, distance to the transmission line, housing density, median census tract income, population and agricultural suitability. These covariates were also measured at 5,000 randomly distributed non-solar locations.
The team modeled the time to solar development at these locations as a Weibull process in a hierarchical Bayesian framework, with rate of solar development a function of covariates and acceleration a function of the state. The data scientists found solar was more likely to be developed in places that were previously cultivated, closer to roads and had low agricultural suitability, and less likely to be developed in areas that were steep, protected and had high tree cover. Rate estimates indicated accelerating rates of development in Delaware, Maryland, Pennsylvania and Virginia.
Using these estimated coefficients, the team projected the relative time to development at 30 m resolution across five states and Washington, D.C. (West Virginia was excluded due to an absence of arrays detected during the study), which can be visualized through a public web application available here. In combination with regulatory and grid capacity data, this 30 m resolution heatmap can help anticipate the location and impacts of future growth and inform synergistic siting.
The coauthors of the paper are Chesapeake Conservancy’s Senior Data Scientist Michael Evans, Ph.D., Data Science Lead/Senior Data Scientist Kumar Mainali, Ph.D., and three former Chesapeake Conservancy team members who have since pursued other professional opportunities: Geospatial Program Manager Rachel Soobitsky, Geospatial Technology Manager Emily Mills and Vice President of Climate Strategy Susan Minnemeyer.
Read the publication “Predicting Patterns of Solar Energy Buildout to Identify Opportunities for Biodiversity Conservation” online via Science Direct.
Tags: commercial and industrial