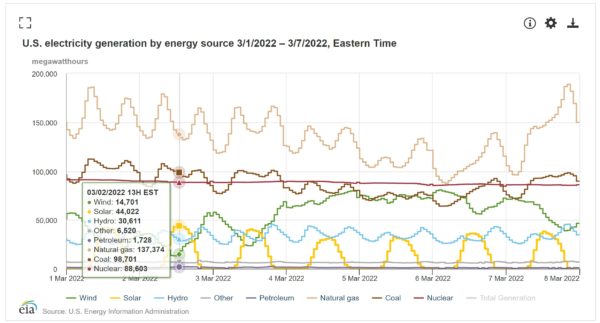
The EIA’s monitor of hourly utility-scale electricity generation for the lower 48 states has recently seen the solar fleet break 50 GW of generation on Sunday and Monday of this week for the first time.
June 8, 2022
The utility-scale solar power plant fleet of the United States has surpassed 50 GW of instantaneous generation. This data comes to us via the Department of Energy’s Energy Information Administration’s (EIA) Hourly Electricity Grid Monitor.
EIA’s grid monitoring tool is a sum of most utility-scale electricity generation in the lower 48 United States. Behind the meter solar generation is not accounted for in these values.
The first time that more than 50 GW was produced in the United States occurred on Sunday June 5, 2022 at 4 pm EST, when the online tool registered solar production at 50,157 MW of total output.
This was brought to pv magazine USA’s attention by a tweet that referenced the event from Joe Deely.
On Monday June 6, the fleet’s instantaneous generation remained above 50 GW generation for three hours – from 2 to 5 pm EST, peaking at just over 51 GW during the 2 pm hour. As the year’s longest day is June 21, 2022, peak solar generation is expected to occur around this period.
Jason O’Leary, principal analyst, PV intel told pv magazine USA that utility-scale solar also broke another key value on March 2 of this year – meeting 10% of the grid’s electricity generation at 1 pm on March 2, 2022.
Since then, solar has broken that 10% value almost 70 times.

On Monday June 6 at 2 pm EST when it set the current peak value at over 51 GW, utility solar was delivering 9.3% of all electricity generation. On March 22 at 2 pm EST saw utility-scale solar peak at 11.3% of all tracked electricity generation.
Per the EIA’s tool, last year’s peak solar generation value reached 38.6 GW on June 14, 2021 at 3 pm EST, which means the peak value so far this year grew just over 24%. Total solar capacity deployed in the United States grew about 25% in 2021 over 2020’s value.
Two important volumes of electricity generation are not included in these values. The first volume – Hawaii and Alaska – would have a peak generation time much later in the day, and thus wouldn’t have had much of an effect on the peak value.
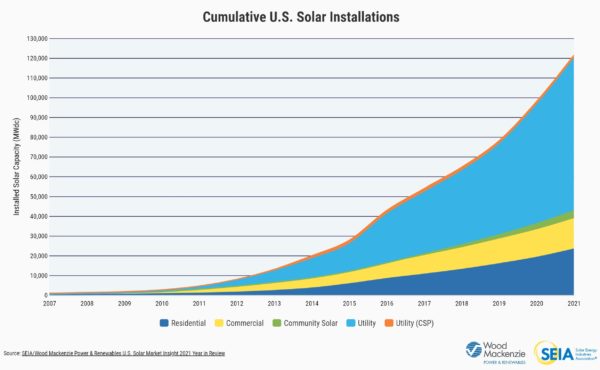
The second volume, however, is massive – that being the non-utility- scale capacity in the nation. According to the Solar Energy Industries Association (SEIA), the US has over 123 GWdc of solar capacity. About 40 GW of that volume is in non-utility-scale settings, and thus is not accounted for by this tool.

If the nation’s roughly 79 GWdc to 83 GWdc of utility-scale capacity is producing 50 GW at its peak, then small scale solar’s roughly 40 GW of volume would likely be outputting in the 20 to 25 GW range, brining the nation’s total peak instantaneous solar generation value into the 70 GW to 75 GW range.


