The U.S. solar industry installed 9.4 GW of new electric generation capacity in Q2 2024, thanks to strong clean energy policy, according to the U.S. Solar Market Insight Q3 2024 report by the Solar Energy Industries Association (SEIA) and Wood Mackenzie.
In August 2022 when President Joe Biden signed the Inflation Reduction Act (IRA) into law, it was the largest climate and energy spending package in U.S. history, but little did we know how the investment would play out in the solar industry. According to the Insight report, in those two years the solar industry has added 75 GW of new capacity to the grid, representing over 36% of all solar capacity built in U.S. history.
“The solar and storage industry is turning federal clean energy policies into action by rapidly creating jobs and powering economic growth in all 50 states, particularly in battleground states like Arizona, Nevada and Georgia,” said SEIA president and CEO Abigail Ross Hopper.
Residential
While the growth in Q2 was a record second quarter for the industry, the growth was not even across all sectors. The residential solar market installed 1.1 GW, its lowest quarter in nearly three years. The contraction was due to policy changes in California and high interest rates nationally.
Unfortunately the downturn in residential solar led many installers to lay off staff, and two major bankruptcies, Titan Solar and SunPower, made headline news.
Based on these factors, Wood Mackenzie expects a 19% year-over-year reduction in residential installations in 2024. California, which made up over 30% of residential solar last year, is expected to see a drop of 41% compared to 2023.
Other states are expected to see an 8% decline in residential installations this year; however, the Insight report sees a recovery coming and expects growth of 14% for this sector in 2025. This growth will be driven in part by an uptick in third-party ownership and qualification for the ITC bonus adders, as well as increasing electric rates. In the long term, the report authors expect the market to add over 33 GW between 2026 and 2029.
Commercial
The commercial solar sector saw 877 MW installed in the first half of 2024, an increase of 6% year-over-year in Q2. The growth was driven in part by strong volumes in California and Illinois. In California, it was partly the NEM 2.0 market installing before the change in net metering. More mature states such as New Jersey and New York had strong quarters, despite their pipelines declining over the past few quarters, the report says. In new markets, commercial developers benefit from land availability, lower costs and increasing energy prices.
As a result of low installations across many states so far this year, the report’s overall 2024 outlook for commercial solar decreased by 3% compared to last quarter and expectations for 8% average annual growth from 2024 to 2029 continue. 2025, however, will be a tough year for the sector, with a 15% contraction expected, thanks for California’s new net billing scheme. The IRA will come into play in the long term, with the sector expecting to grow to nearly 3 GW in 2029.
Community solar
Community solar typically involves a customer subscribing to a portion of an off-site solar facility’s generating capacity, receiving credits on their utility bills for the electricity produced by the facility. The model is beneficial to those who live in apartment buildings or don’t have the cash or credit to cover the upfront costs of solar.
In the first half of 2024, the Insight report notes that there were 577 MW of community solar installations, a 2% decline compared to H1 2023. Some of the stronger markets, Massachusetts and Maine, had slow quarters with Q2 capacity volumes declining 95% and 52% year-over-year, respectively. And emerging markets failed to meet expectations.
As in other sectors, interconnection is a big challenge, pushing many projects to the end of 2024 or later.
The report authors state that “what could have been a banner year for community solar legislation has instead transformed into a year of disappointments, highlighting the difficulty of getting new community solar programs enacted and off the ground.”
The $7 billion Solar for All program, however, offers hope and is expected to have a positive impact on the community solar sector as programs get off the ground. The Insight report expects this sector to grow at an average annual rate of 2% through 2026 and then contract by 7% on average through 2029. One caveat is that the five-year outlook includes only state markets with programs currently in place and does not include states with proposed program legislation, which means that growth could be higher if legislation is put into place.
Utility scale
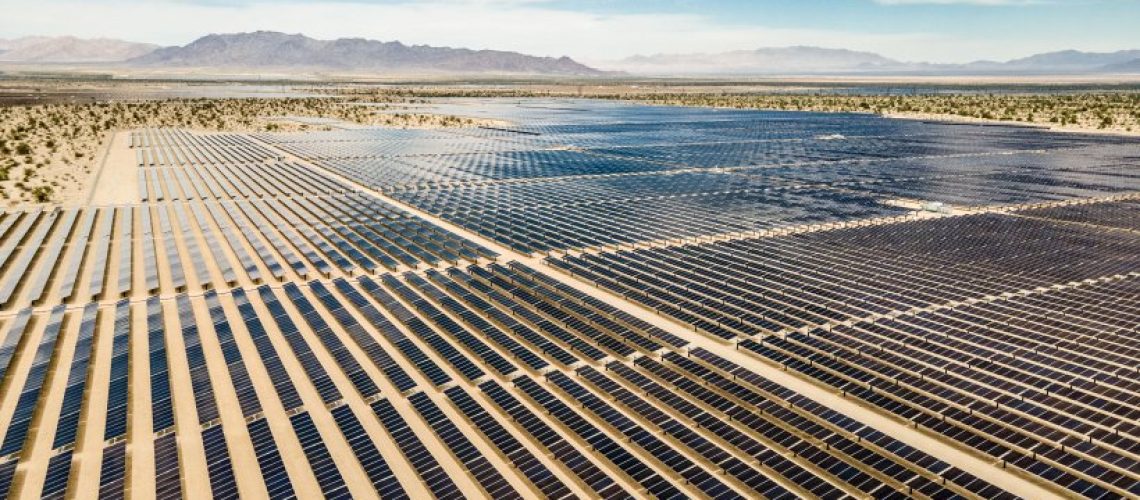
The utility-scale sector enjoyed its strongest Q2 on record, with 7.5 GW of capacity installed, representing 59% year-over-year growth. At the same time, 7.7 GW of new utility-scale projects were contracted in Q2 2024, representing a 23% year-over-year decline. Wood Mackenzie’s five-year forecast is for over 186 GW of new utility-scale solar to come online through 2029, a 1% increase compared to the previous forecast.
Some of the challenges for this sector include difficulty securing EPC firms, long lead times for procuring transformers and high-voltage circuit breakers, and interconnection delays.
Onward
Despite challenges, the U.S. solar industry is on track to install over 250 GW in the next five years, growing to 440 GW of installed capacity. Ongoing support is needed, but with the solar industry as the “foundation of the energy transition,” according to the report authors, it will continue to play the leading role in the energy transition.
To learn more about growth and challenges in the U.S. solar industry, register for pv magazine USA Week, “A Solar P owered Economy” here.
Popular content


